Skip to main content
Select Language
English
Afrikaans
Albanian
Amharic
Arabic
Armenian
Azerbaijani
Basque
Belarusian
Bengali
Bosnian
Bulgarian
Catalan
Cebuano
Chichewa
Chinese (Simplified)
Chinese (Traditional)
Corsican
Croatian
Czech
Danish
Dutch
Esperanto
Estonian
Filipino
Finnish
French
Frisian
Galician
Georgian
German
Greek
Gujarati
Haitian Creole
Hausa
Hawaiian
Hebrew
Hindi
Hmong
Hungarian
Icelandic
Igbo
Indonesian
Irish
Italian
Japanese
Javanese
Kannada
Kazakh
Khmer
Korean
Kurdish (Kurmanji)
Kyrgyz
Lao
Latin
Latvian
Lithuanian
Luxembourgish
Macedonian
Malagasy
Malay
Malayalam
Maltese
Maori
Marathi
Mongolian
Myanmar (Burmese)
Nepali
Norwegian
Pashto
Persian
Polish
Portuguese
Punjabi
Romanian
Russian
Samoan
Scottish Gaelic
Serbian
Sesotho
Shona
Sindhi
Sinhala
Slovak
Slovenian
Somali
Spanish
Sudanese
Swahili
Swedish
Tajik
Tamil
Telugu
Thai
Turkish
Ukrainian
Urdu
Uzbek
Vietnamese
Welsh
Xhosa
Yiddish
Yoruba
Zulu
Home
Parents
Parents & Families
Arizona Purple Star School Program
Early Childhood & Preschool
Empowerment Scholarship Account
Military Career Information
School Report Cards
Transcripts & Test Scores
U.S. Senate Youth Scholarship Program
Educators & Administrators
Academic Standards
Accountability
Assessment
Business & Finance >
School Finance
State & Federal Grants
School Safety
Certification & Leadership >
Educator Certification
Educator Recruitment & Retention
Effective Teachers & Leaders (Trainings)
Training & Professional Development
Post-Secondary Resources
Support & Improvement
Programs
Academic Achievement >
Academic Achievement
Afterschool & 21st Century Learning Centers
Character Education
English Learners | OELAS & Migrant Education Program
Homeless, Foster Care, & Refugee Programs
Title I
Adult Education
Arizona Purple Star School Program
Career & Technical Education
Educator Leadership >
Charter School Program
Effective Teachers & Leaders
School Safety
Gifted/Advanced Learning >
Gifted/Advanced Learning
College Credit by Examination
Dual Enrollment
Gifted Education
Grants Management
Health & Nutrition Services
Office of Indian Education
Special Education
About ADE
About the Department
Accounting & Procurement
Agency Budget
Contact Us
Data Governance
Employment Opportunities
Information Technology
News Releases
Print Shop
State Board for Charter Schools
State Board of Education
Submit a Complaint
Data & Systems
ADEL (Arizona Digital Educators Library)
APLD (Professional Learning and Development)
Public Educator Search
School & Student Data
School Report Cards
Teacher Input Application (TIA)
ADEConnect
ADEConnect
Common Logon
Search
Home
OELAS
EL Demographics 2013-2014
EL Demographics 2013-2014
Approximate Number of EL Students in Arizona
85,000
Percent of Arizona Students who are EL Students
7%
Statewide Reclassification Rate
(Based on FAY Students)
30%
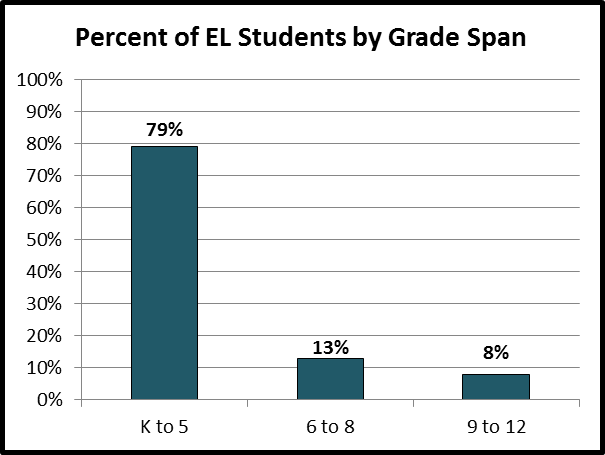
fy14-demographics-grades-acc.png
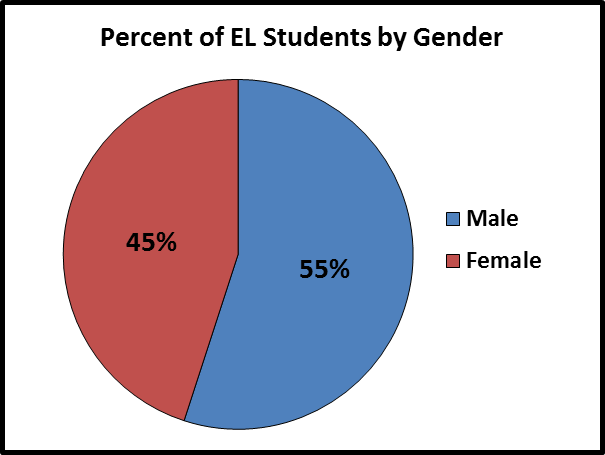
fy14-demographics-gender-acc.png
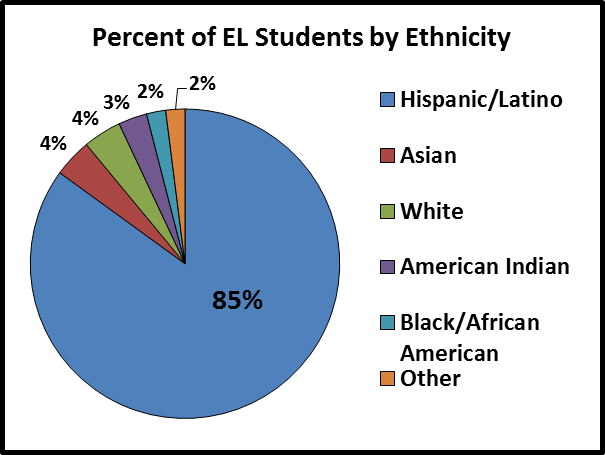
fy14-demographics-ethnicity-acc.png
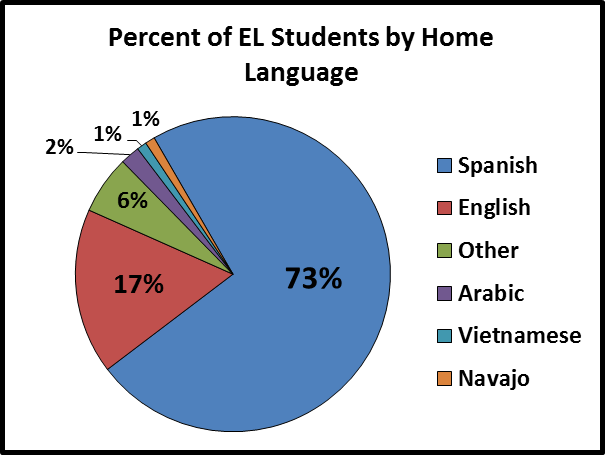
fy14-demographics-language-acc.png
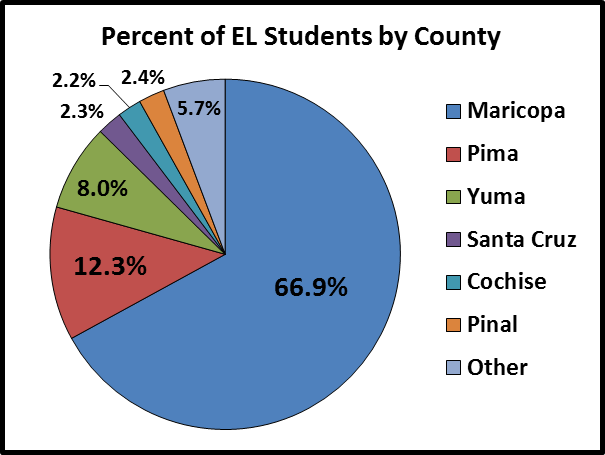
fy14-demographics-county-acc.png