mobile menu
Arizona Department of Education Homepage
  • SY 2022-2023
  • Home
  • Students & Families
    • Adult Education
    • Early Childhood & Preschool
    • Empowerment Scholarship Account (ESA)
    • Parents & Families
    • School Report Cards
    • Transcripts & Test Scores
  • Educators
    • Academic Standards
    • Assessment
    • Career & Technical Education
    • Certification & Career
    • Post-Secondary & ECAP
    • Public Educator Search
    • Support & Improvement Resources
    • Training & Professional Development
  • Administrators
    • Accountability
    • School & Student Data
    • School Finance
    • School Support & Improvement
    • State & Federal Grants
    • Training & Conferences
  • Programs & Supports
    • Afterschool & 21st Century Learning Centers
    • Educator and School Excellence
    • English Learners | OELAS & Migrant Education Program
    • Gifted & Advanced Learning
    • Health & Nutrition Services
    • Homeless, Foster Care, & Refugee Programs
    • Information Technology
    • Office of Digital Teaching & Learning
    • Office of Indian Education
    • School Safety & Social Wellness
    • Special Education
  • About ADE
    • About the Department
    • News Releases
    • Contact Us
    • Critical Race Theory Explained
    • Data Governance
    • Events
    • State Board of Education
    • State Board for Charter Schools
    • Submit a Complaint
  • ADEConnect
    • ADEConnect
    • Common Logon
  • Search
  • Home
  • OELAS
  • Archived EL Demographics

Archived EL Demographics


Approximate Number of EL Students in Arizona

83,500


Percent of Arizona Students who are EL Students

7%

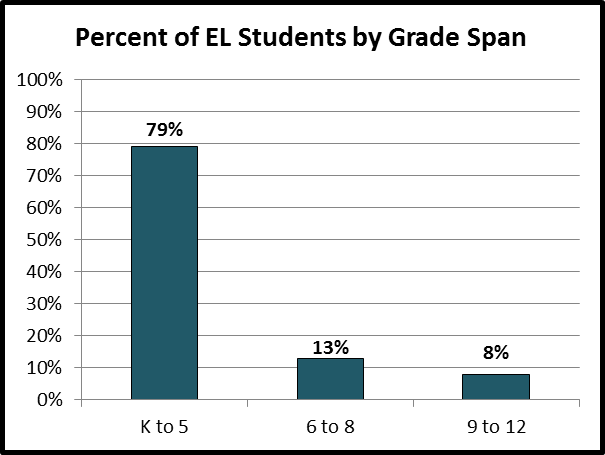
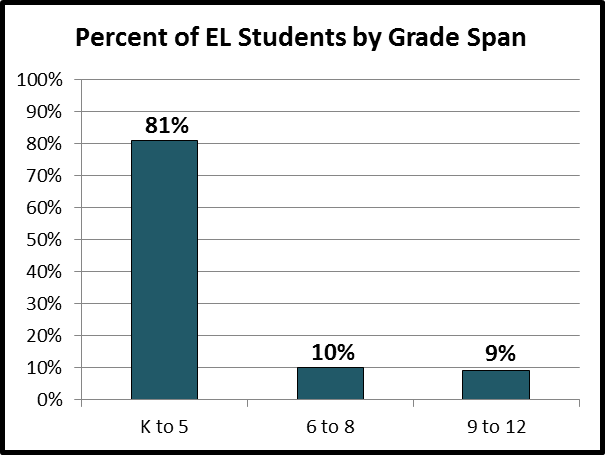
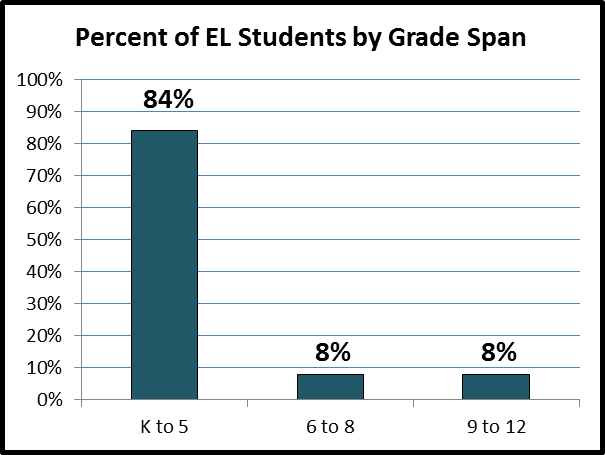
Percent of Arizona Students who are EL by Grade Level  

Grade LevelPercent EL
K16%
111%
211%
310%
410%
58%
65%
75%
84%
96%
103%
112%
121%


Approximate Number of EL Students in Arizona

85,000


Percent of Arizona Students who are EL Students

7%


Statewide Reclassification Rate

(Based on FAY Students)

30%


fy14-demographics-grades-acc.png

Bar graph of Arizona EL students by grade span: 79% K to 5, 13% 6 to 8, 8% 9 to 12

fy14-demographics-gender-acc.png

Pie chart of Arizona EL students by gender: 55% male, 45% female

fy14-demographics-ethnicity-acc.png

Pie chart of Arizona EL students by ethnicity: 85% Hispanic/Latino, 4% Asian, 4% White, 3% American Indian, 2% Black/African American, 2% Other

fy14-demographics-language-acc.png

Pie chart of Arizona EL Students by home language: 73% Spanish, 17% English, 6% Other, 2% Arabic, 1% Vietnamese, 1% Navajo

fy14-demographics-county-acc.png

Pie chart of Arizona EL students by county: 66.9% Maricopa County, 12.3% Pima County, 8.0% Yuma County, 2.4% Pinal County, 2.3% Santa Cruz County, 2.2% Cochise County, 5.7% Other


Approximate Number of EL Students in Arizona

83,000


Percent of Arizona Students who are EL Students

7%

Statewide Reclassification Rate

(Based on FAY Students)

24%

fy13-demographics-grades-acc.png

Bar graph of Arizona EL students by grade span: 81% K to 5, 10% 6 to 8, 9% 9 to 12

fy13-demographics-gender-acc.png

Pie chart of Arizona EL students by gender: 55% male, 45% female

fy13-demographics-ethnicity-acc.png

Pie chart of Arizona EL students by ethnicity: 85% Hispanic/Latino, 4% Asian, 4% White, 3% American Indian, 2% Black/African American, 2% Other

fy13-demographics-language-acc.png

Pie chart of Arizona EL Students by home language: 76% Spanish, 14% English, 8% Other, 1% Arabic, 1% Vietnamese

fy13-demographics-county-acc.png

Pie chart of Arizona EL students by county: 67.4% Maricopa County, 12.2% Pima County, 8.6% Yuma County, 2.1% Pinal County, 2.2% Santa Cruz County, 2.2% Cochise County, 5.3% Other


Approximate Number of EL Students in Arizona

87,000

Percent of Arizona Students who are EL Students

7%

Statewide Reclassification Rate

(Based on FAY Students)

31%

fy12-demographics-grades-acc.png

Bar graph of Arizona EL students by grade span: 84% K to 5, 8% 6 to 8, 8% 9 to 12

fy12-demographics-gender-acc.png

Pie chart of Arizona EL students by gender: 55% male, 45% female

fy12-demographics-county-acc.png

Pie chart of Arizona EL students by county: 67.1% Maricopa County, 12.7% Pima County, 8.3% Yuma County, 2.2% Pinal County, 2.2% Santa Cruz County, 2.2% Cochise County, 5.3% Other


  • AZELLA
  • EL Data
  • EL Forms
  • EL Monitoring
  • ELP Standards
  • OELAS Conference
  • Professional Learning
  • SEI Budget
  • SEI Endorsement
  • SEI Models
  • Title III
  • _______________
  • OELAS Contacts
  • OELAS Guidance to the Field
  • OELAS Resources
  • _______________
  • AZ Academic Standards
  • Seal of Biliteracy

Contact

  • English Learners
  • [email protected]
  • About Us
  • Careers
  • Contact Us
  • Certification
  • Language / Lenguaje
  • Privacy Policy
  • School Report Cards
  • State Board of Education
  • State Board for Charter Schools
  • Web Accessibility

© 2023 Arizona Department of Education

Social Links

Arizona Department of Education Twitter
Arizona Department of Education Facebook Page
  • Statewide Policies
  • Site Map